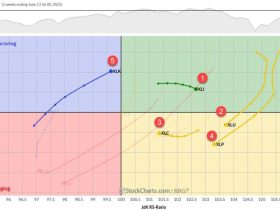
This Time Technology Beats Financials After a week of no changes, we’re back with renewed sector movements, and it’s another ...
With Friday’s pullback after a relatively strong week, the S&P 500 chart appears to be flashing a rare but powerful ...
With Friday’s pullback after a relatively strong week, the S&P 500 chart appears to be flashing a rare but powerful ...
This week, Julius shows how the Technology sector is edging toward leadership, alongside Industrials and soon-to-follow Communication Services. He highlights ...
Joe kicks off this week’s video with a multi‑timeframe deep dive into the 10‑year U.S. Treasury yield (TNX), explaining why ...
The U.S. stock market has been painting a subtle picture recently. While the broader indexes, such as the S&P 500 ...
There are a few very different setups unfolding this week that are worth a closer look: two software-related names that ...
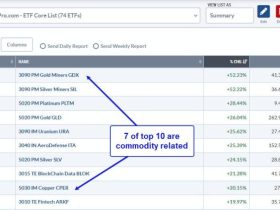
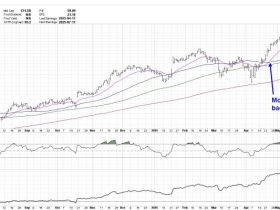
QQQ and tech ETFs are leading the surge off the April low, but there is another group leading year-to-date. Year-to-date ...
Stay ahead of the market in under 30 minutes! In this video, Mary Ellen breaks down why the S&P 500 ...
I’m a huge fan of using platforms like StockCharts to help make my investment process more efficient and more effective. ...
A lot has happened in the stock market since Liberation Day, keeping us on our toes. Volatility has declined significantly, ...
In this market update, Frank breaks down recent developments across the S&P 500, crypto markets, commodities, and international ETFs. He ...

